You can download the software from the Vensim Website
There may be two two versions of the software as a result of recent upgrades.
They will give you slightly different versions of the interface. The software functions exactly the same with both versions.
Once you have done that you can now complete this short tutorial which outlined the mechanics of using the software. The small model that you develop is designed to investigate two of the great philosophical problems of Western civilisation: which came first to chicken or the egg and why did the chicken cross the road?
When you open the software you will see this dialogue box.
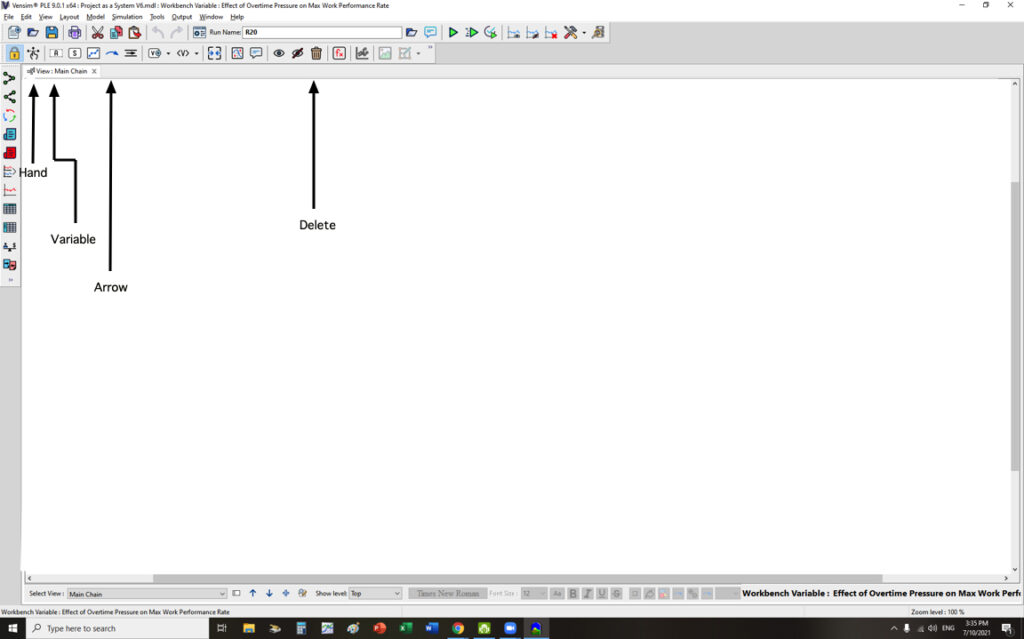
Click OK and the modelling benchtop will open.
We are only going to use a limited number of the tools on the bench top.
Version 1

Version 2
We are going to build a simple model of the chicken and egg problem.
Click on the variable button
Drag it to the workbench
Click again and a dialogue box will open
Type Chicken
Click again on the bench top and another dialogue box will open
Type Egg ( you can use the Hand to align the two words)

Click on the arrow button
Drag it onto the word Chicken
Click and drag the arrow to the word Egg

On the benchtop you will have a small circle in the middle of the arrow. This is used to change the shape of the arrow
Drag it upwards to reshape the arrow

Draw a connection between Eggs and Chickens
Reshape the arrow

We have now sketched a causal relationships chickens cause eggs and eggs cause chickens. We can now put in the dynamics of this relationship.
Use the Hand to click on the arrowhead at Egg

Click on the causal arrow button

This menu will drop down for you

Click on the S ( this indicates that number of Eggs will change in the same way as the number of chickens. If chickens go up, then eggs will increase. If chickens go down, then the number of eggs will also go down.)

You can enlarge the type size using the typeface command

Repeat this for the arrow connecting Egg and Chicken.

What you have here is called a reinforcing loop, with a number of chickens goes up and the number of acres goes up ending the number of chickens goes up. It’s the classic exponential growth cycle.
We are now ready to move on to the question of why the chicken crossed the road and more importantly what happened when crossed the road.

As the number of chickens increase, the number of road crossings will also increase, so create a causal arrow with an S at the end of it.

Now, as the number of Roadcrossings increases, the number of chickens declines (chickens traditionally having a very poor sense of road safety).
So the causal arrow between Road crossings and chickens has an O because as road crossings increase, the number of chickens declines, namely moves in the opposite direction.

The loop on the left-hand side of the diagram is called a balancing loop, because the road crossings tend to bring the number of chickens back into balance. This raises the question of “loop dominance” which is a technical term for deciding which of the loops is the most influential. In this case is likely to be the reinforcing loop on the right-hand side of the diagram.
This completes the tutorial designed to familiarise you with the causal diagramming function in the Vensim software. You can now return to the main causal loop diagram tutorial.